
A modular platform for district planning
SPS+ combines enrollment forecasting, housing development tracking and geographic analysis into a unified planning system designed for school districts.

SPS+ combines enrollment forecasting, housing development tracking and geographic analysis into a unified planning system designed for school districts.

Generate long-term enrollment forecasts using historical trends, applying yields to housing development, retention rates and migration patterns to help you anticipate school capacity pressure early and support capital planning decisions.
Create multiple planning scenarios that forecast enrollment growth over time, allowing districts to compare different planning strategies and future conditions.
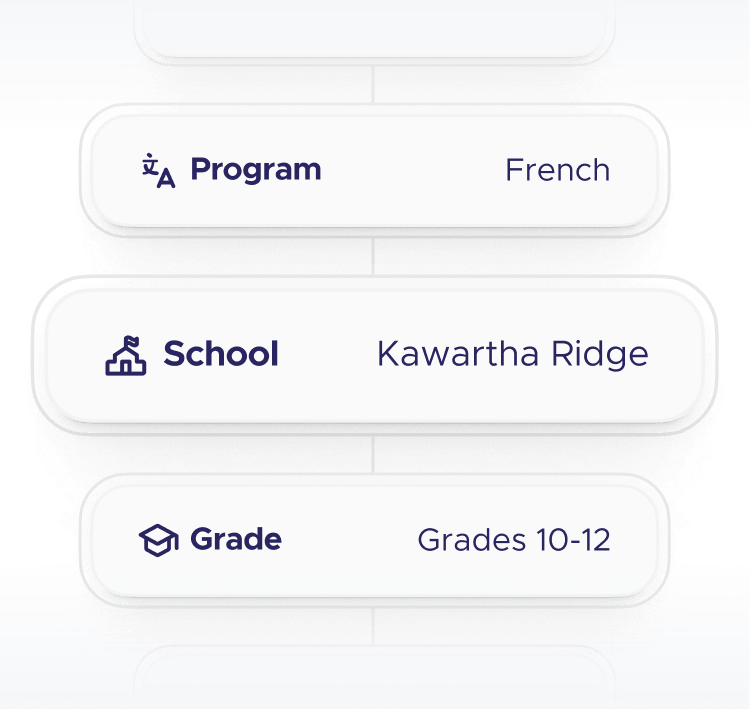
Generate detailed projections that break down enrollment by grade level, program type such as French immersion, and individual schools.
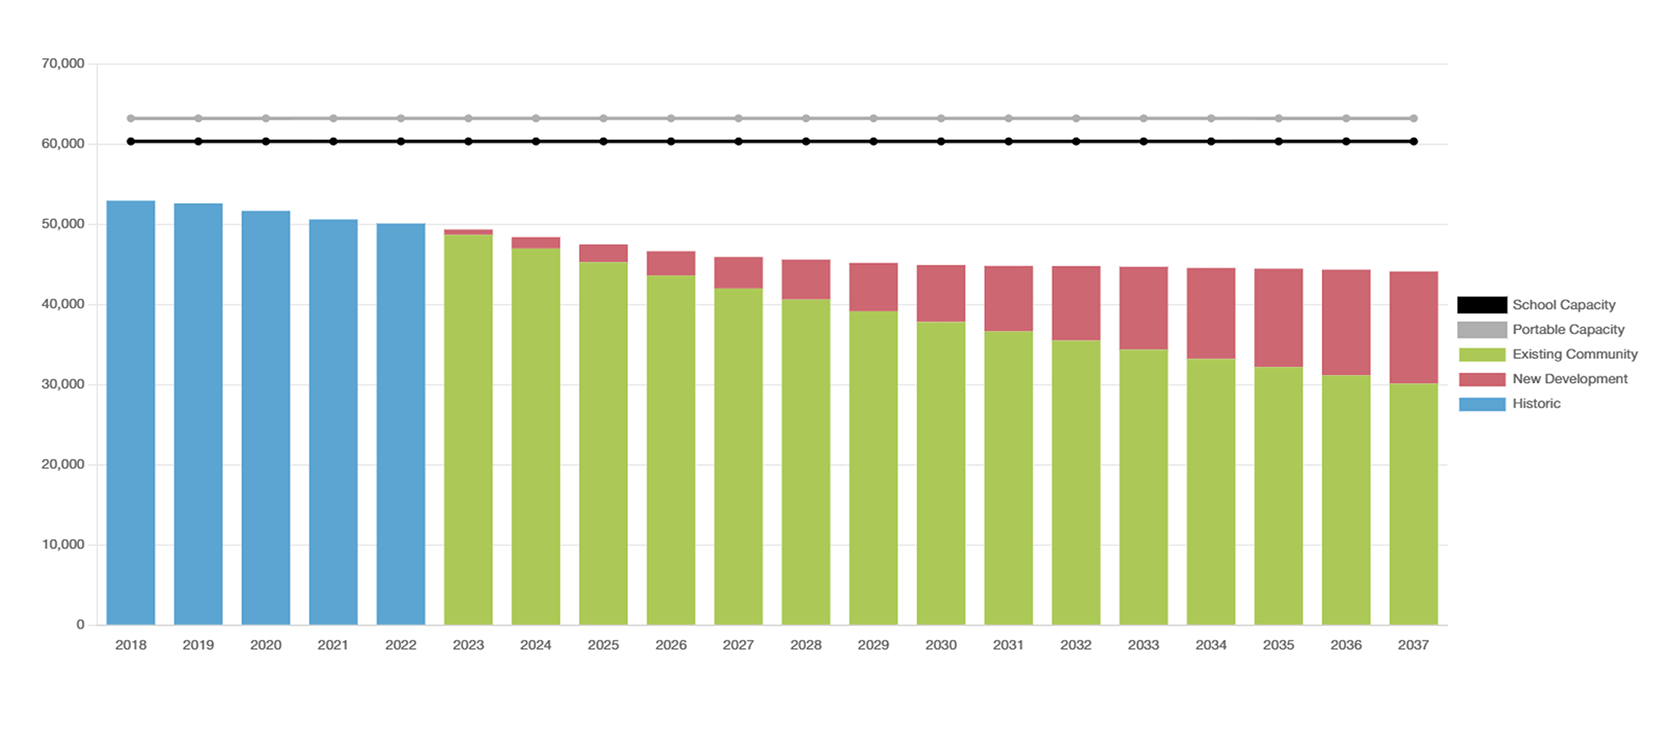
Visualize projected enrollment against school capacity to quickly identify where schools may become over- or under-utilized.
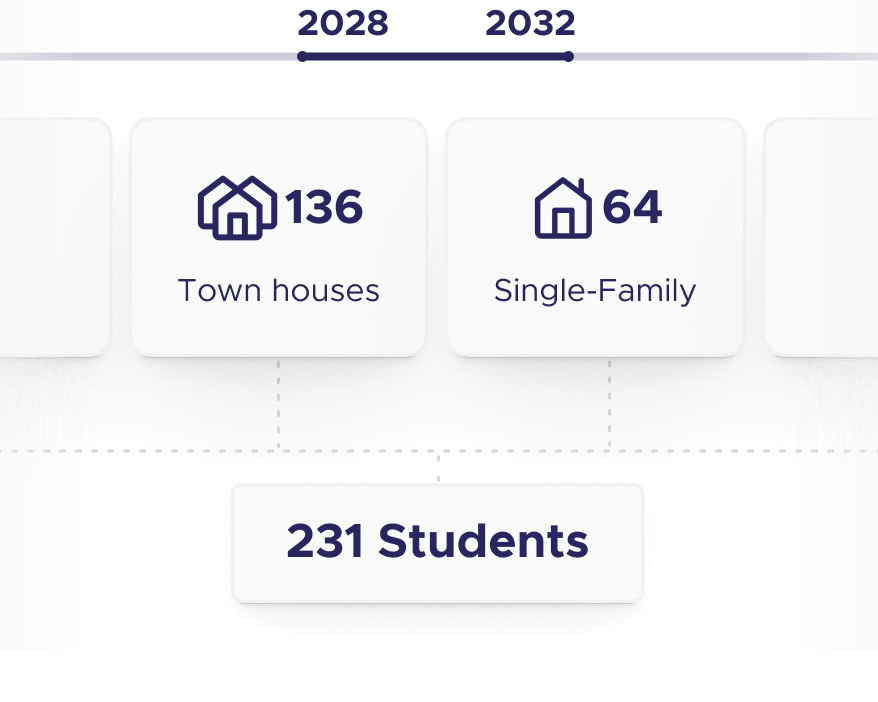
Incorporate housing development data to estimate how new residential growth will translate into future student enrollment.
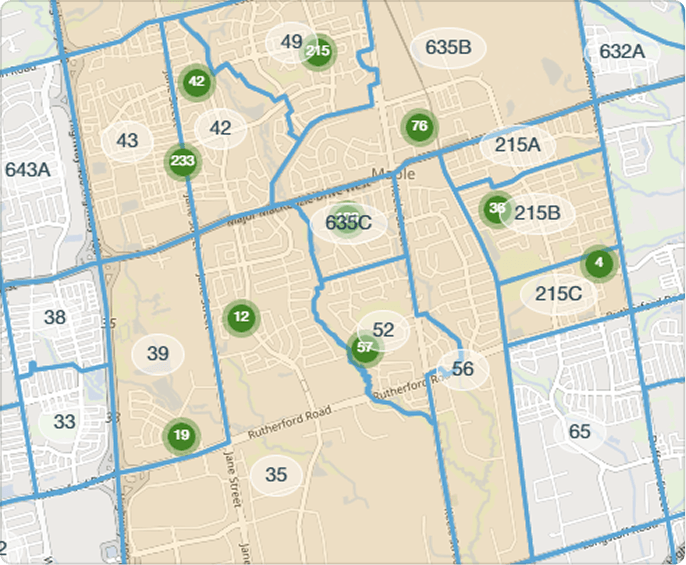
Combine enrollment projections with geographic data to understand how growth patterns affect specific neighborhoods, catchments, and schools.

Track municipal development and translate housing growth into future student enrollment, allowing you to anticipate enrollment growth from new housing developments.
Capture municipal development data including housing projects, permits, and planned construction to understand how communities are growing.
Estimate student generation by applying historical yield factors for different housing types such as apartments, townhomes, or single-family homes.
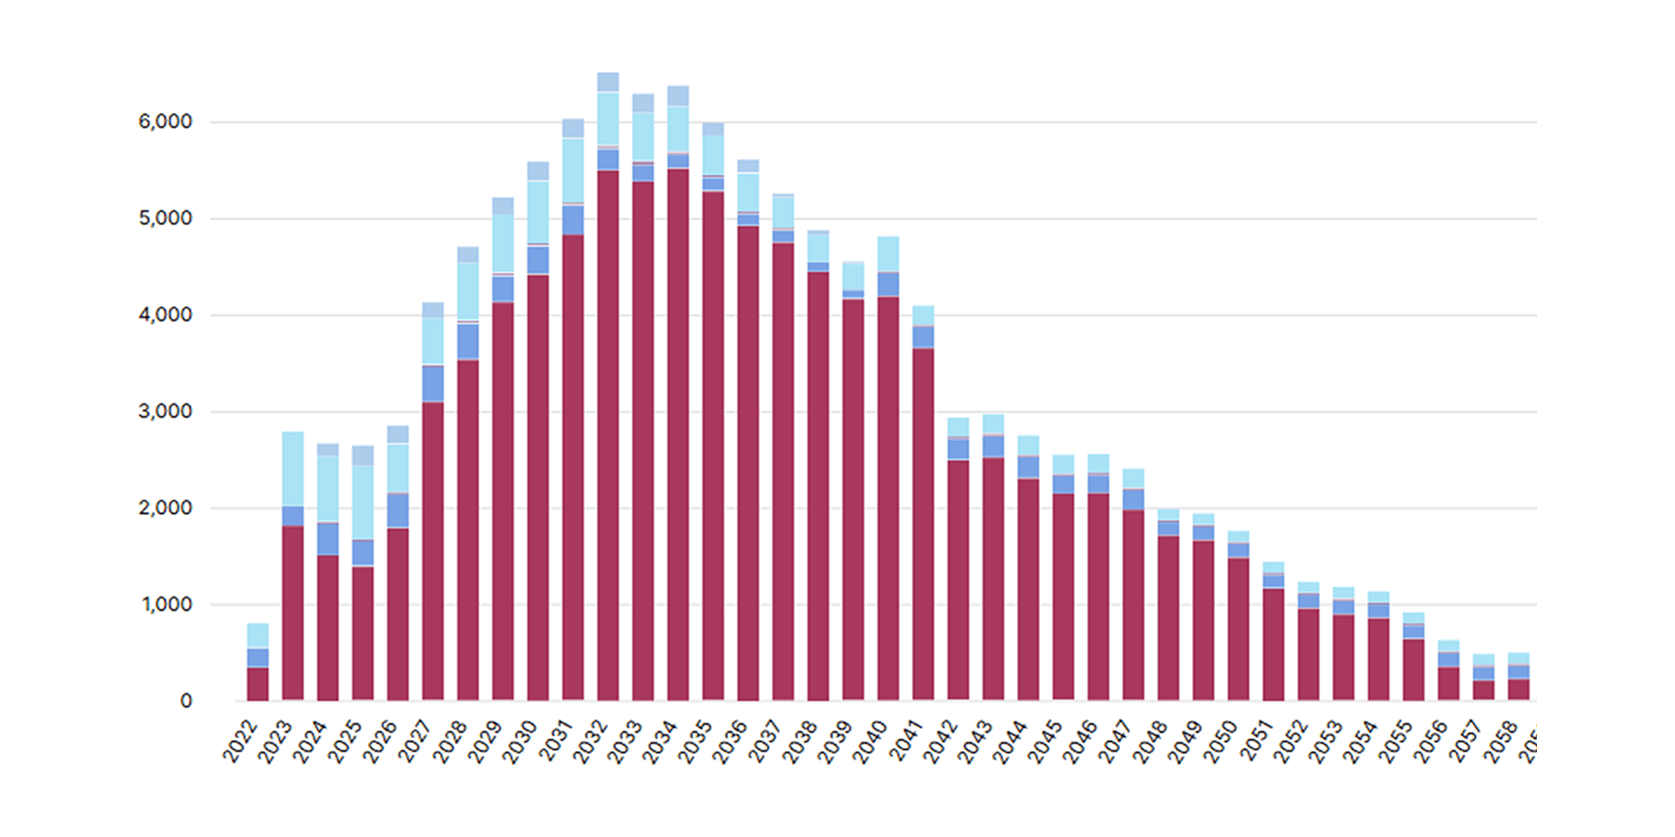
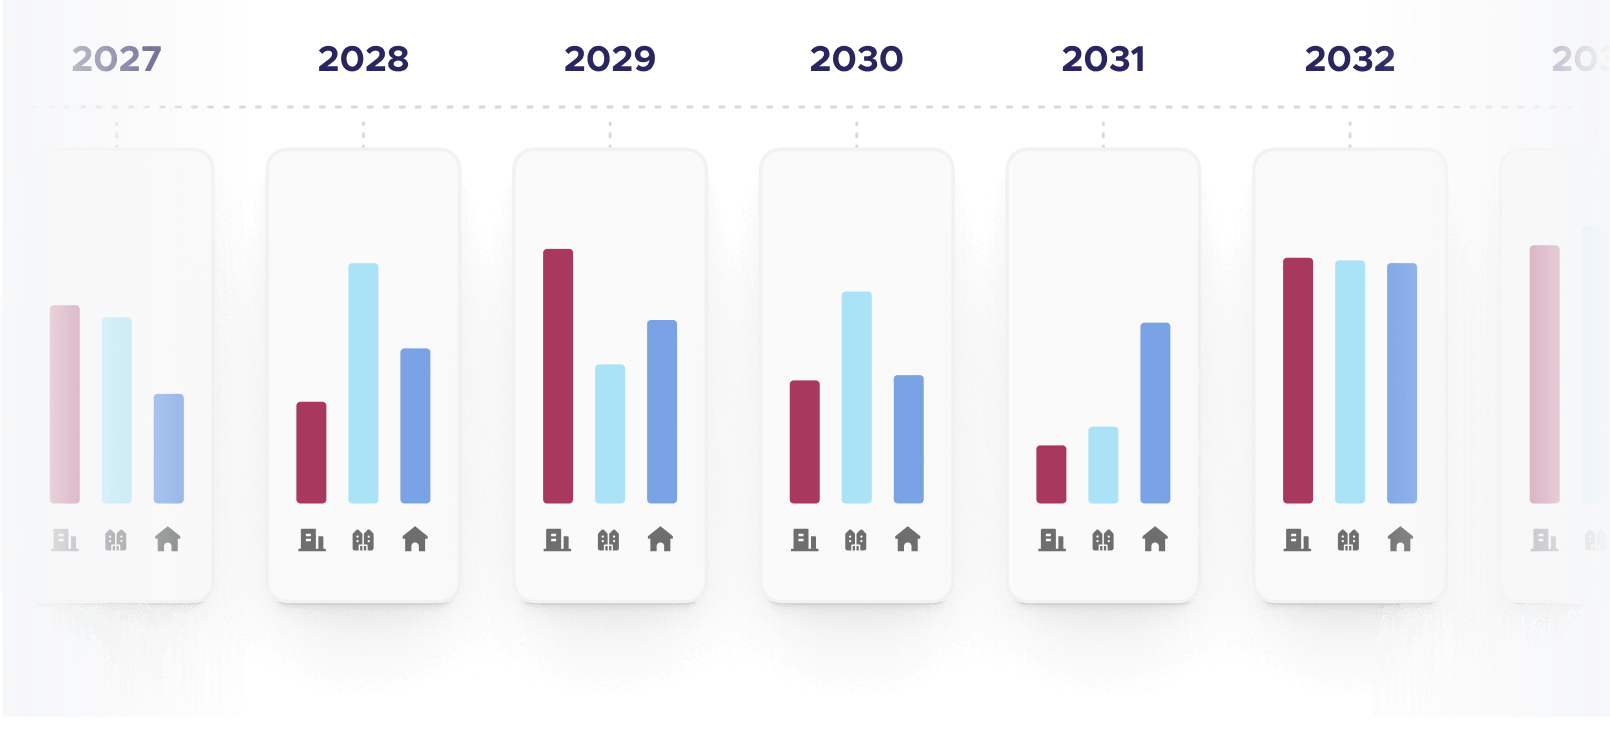
Project when new housing developments will be completed and how developments are expected to impact projected enrollment.
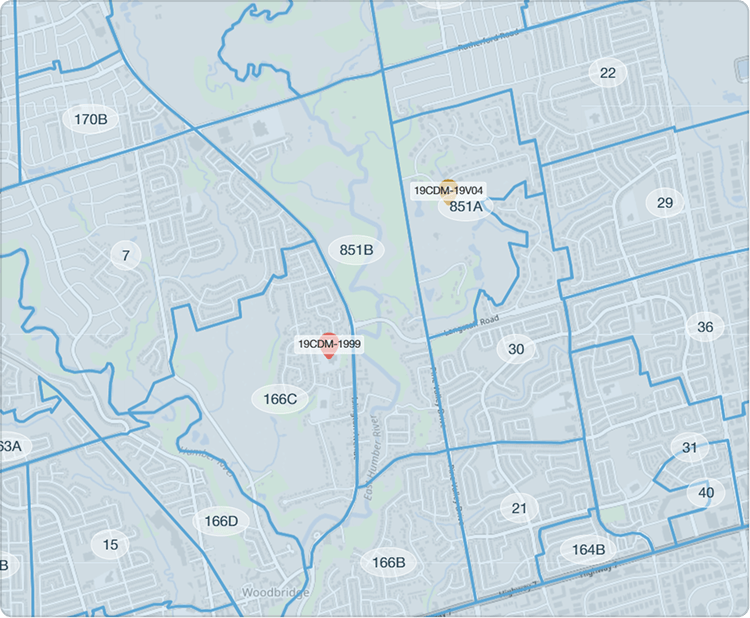
View housing developments to visualize where potential growth will occur and impact that catchment area.

Understand where students live relative to school boundaries and identify utilization pressure to support evidence-based boundary review discussions and capacity planning.
Analyze enrollment patterns at a granular geographic level to better understand how students are distributed across the district.
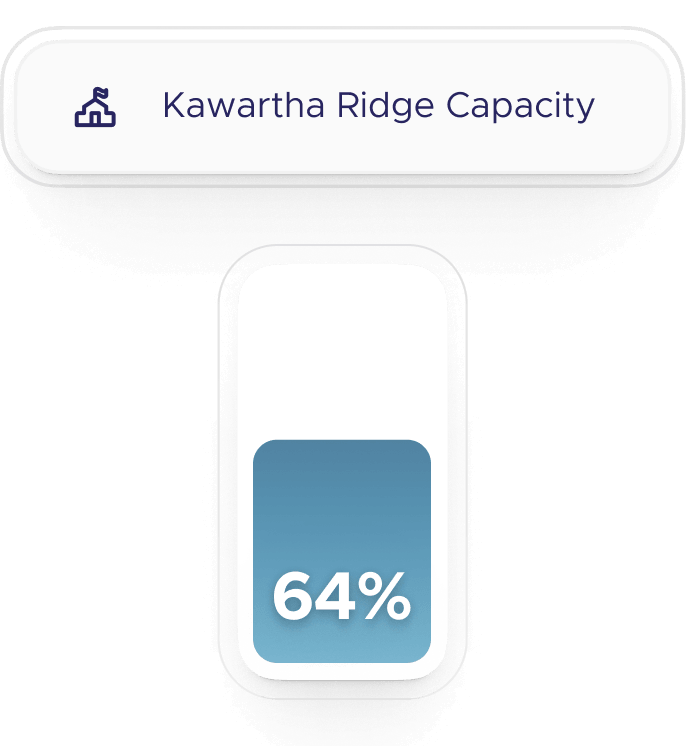
Evaluate how effectively each school's boundary area is serving its student population relative to available capacity.
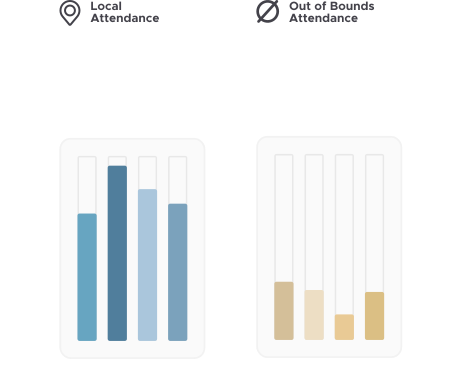
Detect when students are attending schools outside their assigned boundaries and understand where those patterns originate.
Track how enrollment patterns and boundary pressures change over multiple years to identify emerging planning challenges.
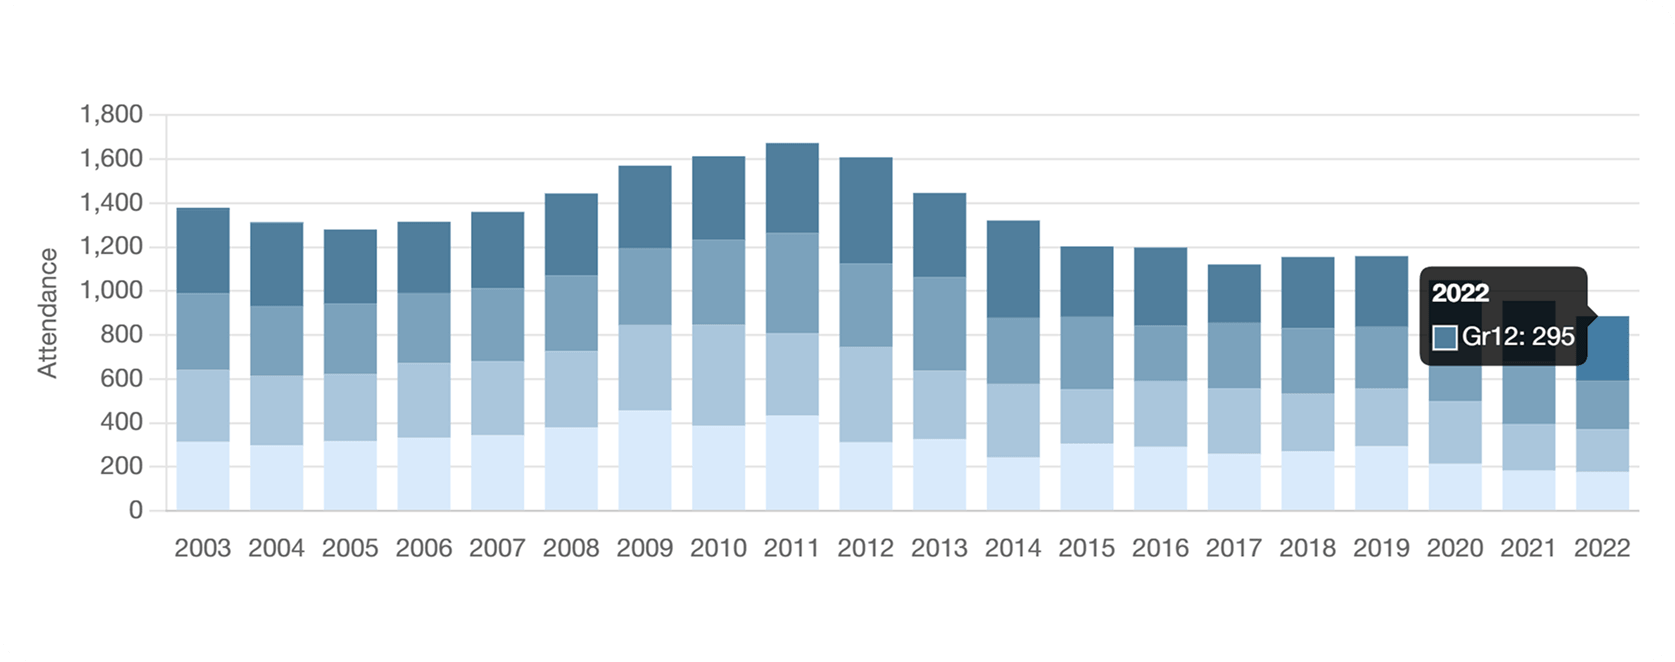

Easily identify schools where re-districting is required.

Test planning scenarios when schools approach or exceed capacity, helping planners test solutions before implementing district-wide changes.
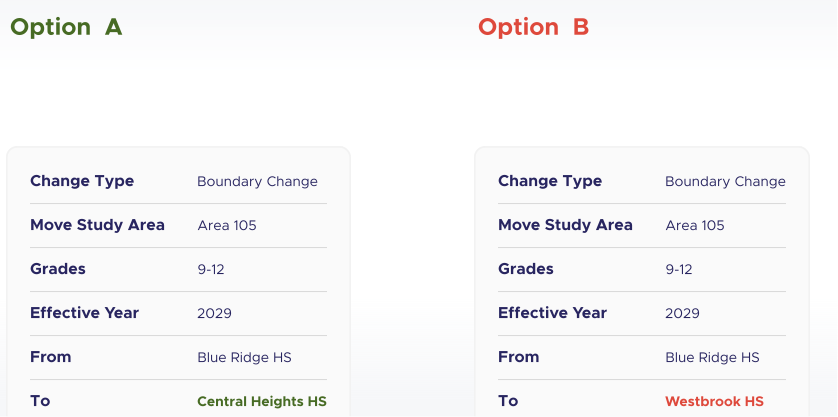
Test potential “what-if” boundary changes within planning scenarios to evaluate how redistricting could impact enrollment distribution.
Simulate shifting student populations between schools to relieve overcrowding or improve utilization.
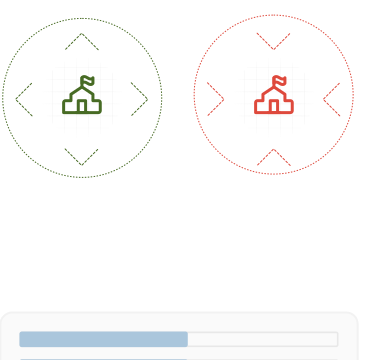
Evaluate multiple planning strategies side by side to determine which solution best balances capacity across schools.
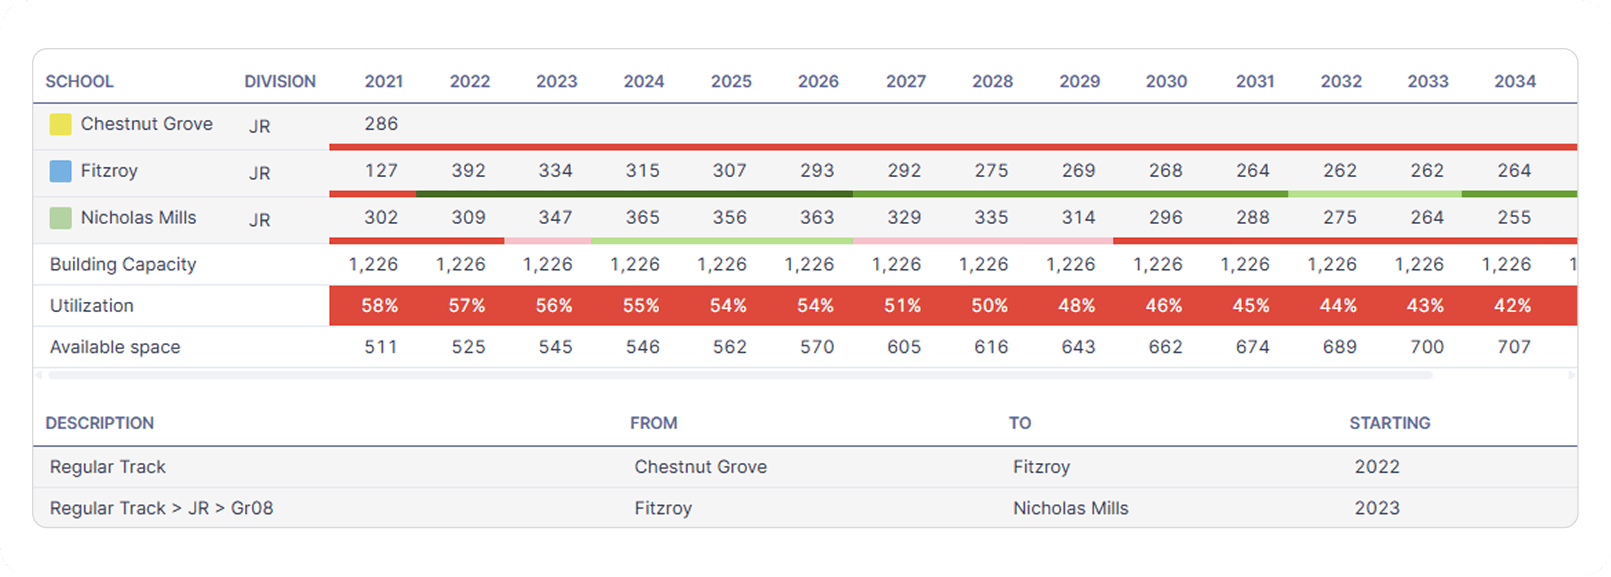
Determine which solution best balances capacity utilization across schools, and project when enrollment pressures are expected to impact school capacities.

Embed the School Locator widget into your district's website to allow parents to search for the schools and programs available for their children based on their address. Seamlessly align school and specialty program boundaries set by your planning team with your district's communication team for accurate school registration purposes.
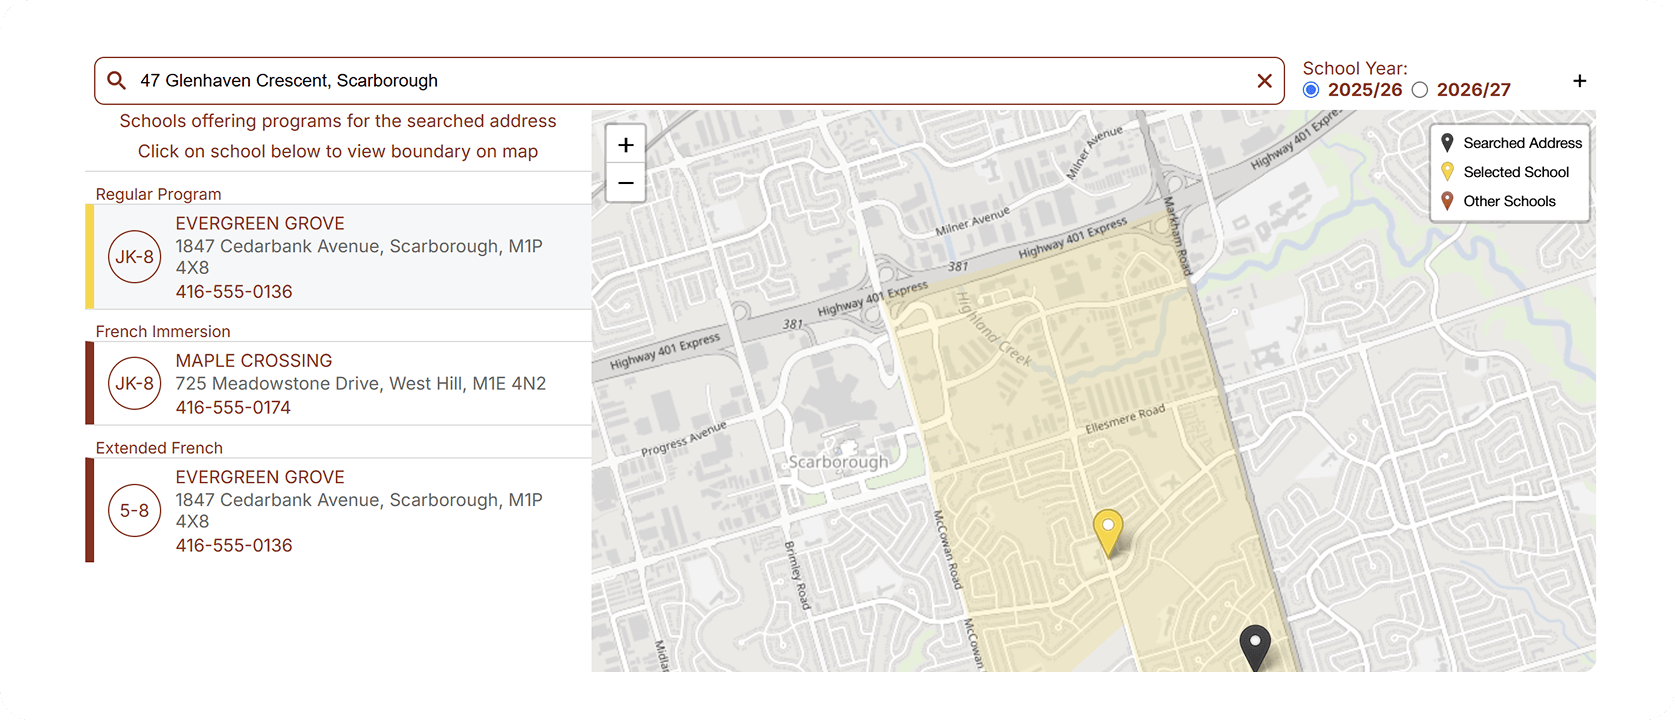
Display school and program boundaries on an interactive map to clearly show which catchment areas belong to each school or program.
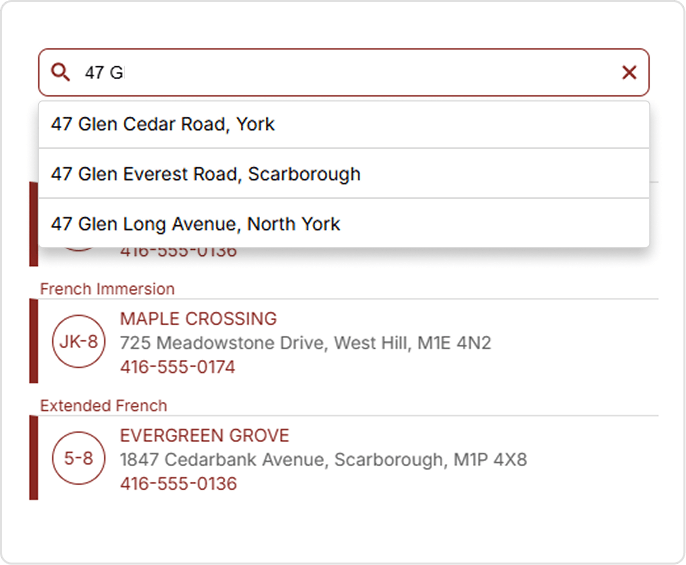
Quickly find designated schools with intelligent address suggestions and automatic validation.
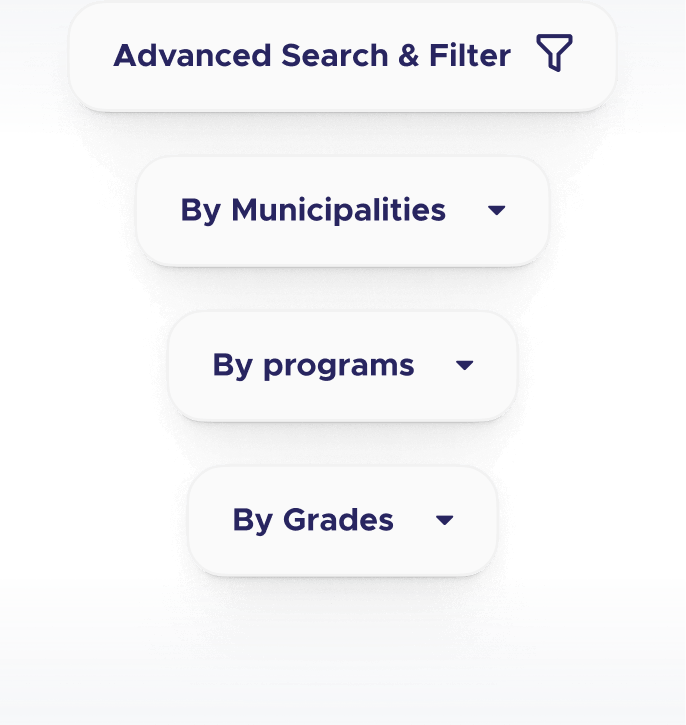
Narrow school results by program, grade, and municipality to find the right designated school faster.

Provide school assignments based on program availability, such as regular track or French immersion.
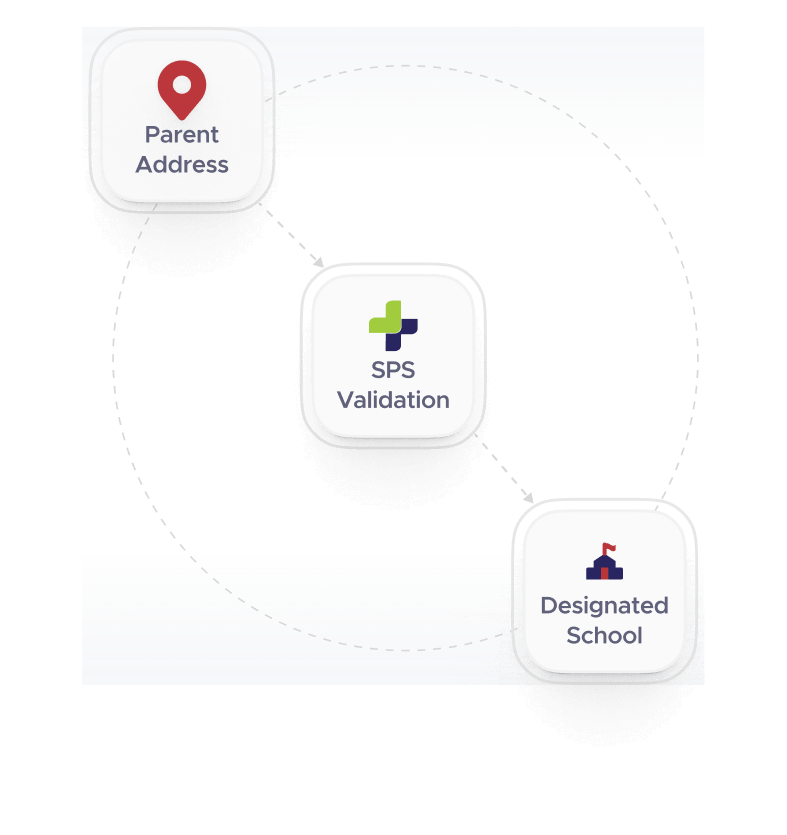
Connect the school locator to online registration workflows so school assignments are automatically validated during enrollment.

Combine student data, geography, and enrollment projections in spatial models.

Easily import individual and/or aggregated student data applying district specific rules to ensure data quality.

Generate a multitude of charts, maps, and datasets to be exported in popular formats to support creating presentations and documents.

Seamlessly plot student and housing data on maps for easy analysis.
See how SPS+ helps school districts anticipate enrollment changes, evaluate planning scenarios, and make better long-term decisions.